
Newark, New Jersey
The Verdict
Newark's tap water quality is rated Good (B+). The water meets EPA standards for heavy metals, with low lead detection at 23% of EPA limits. Further on, we'll explain our grading system and what led us to this conclusion. Finally, we'll take a look at how neighboring communities' tap water stacks up to Newark's.
Summary
Newark is New Jersey's largest city and Essex County's urban hub, serving over 300,000 residents with water drawn from the Pequannock Watershed in West Milford and the Wanaque Reservoir. The Pequannock Watershed has significantly lower PFAS or 'forever chemicals' than many New Jersey source waters, which tends to result in better tap water. The city operates its own water treatment facilities to serve both residents and surrounding communities.
According to Newark's 2024 Consumer Confidence Report, the water system continues its long-standing infrastructure improvement program, including ongoing lead service line replacement efforts. The city has made significant progress in reducing lead exposure through corrosion control treatment and proactive pipe replacement. Recent testing shows PFAS levels that periodically exceed future EPA guidelines, though these limits are not yet legally enforceable. The water system maintains full compliance with all current federal and state regulations.
Good News
All levels of biological and radiological contaminants, pesticides and left-over disinfecting products were either undetectable or well within EPA limits.
Without water, life is not possible. It's needed for transporting and dissolving nutrients, maintaining body temperature as well as our very shape. In fact, humans are about 60% water. Drinking quality water is as important for good health and longevity as eating well and exercising.
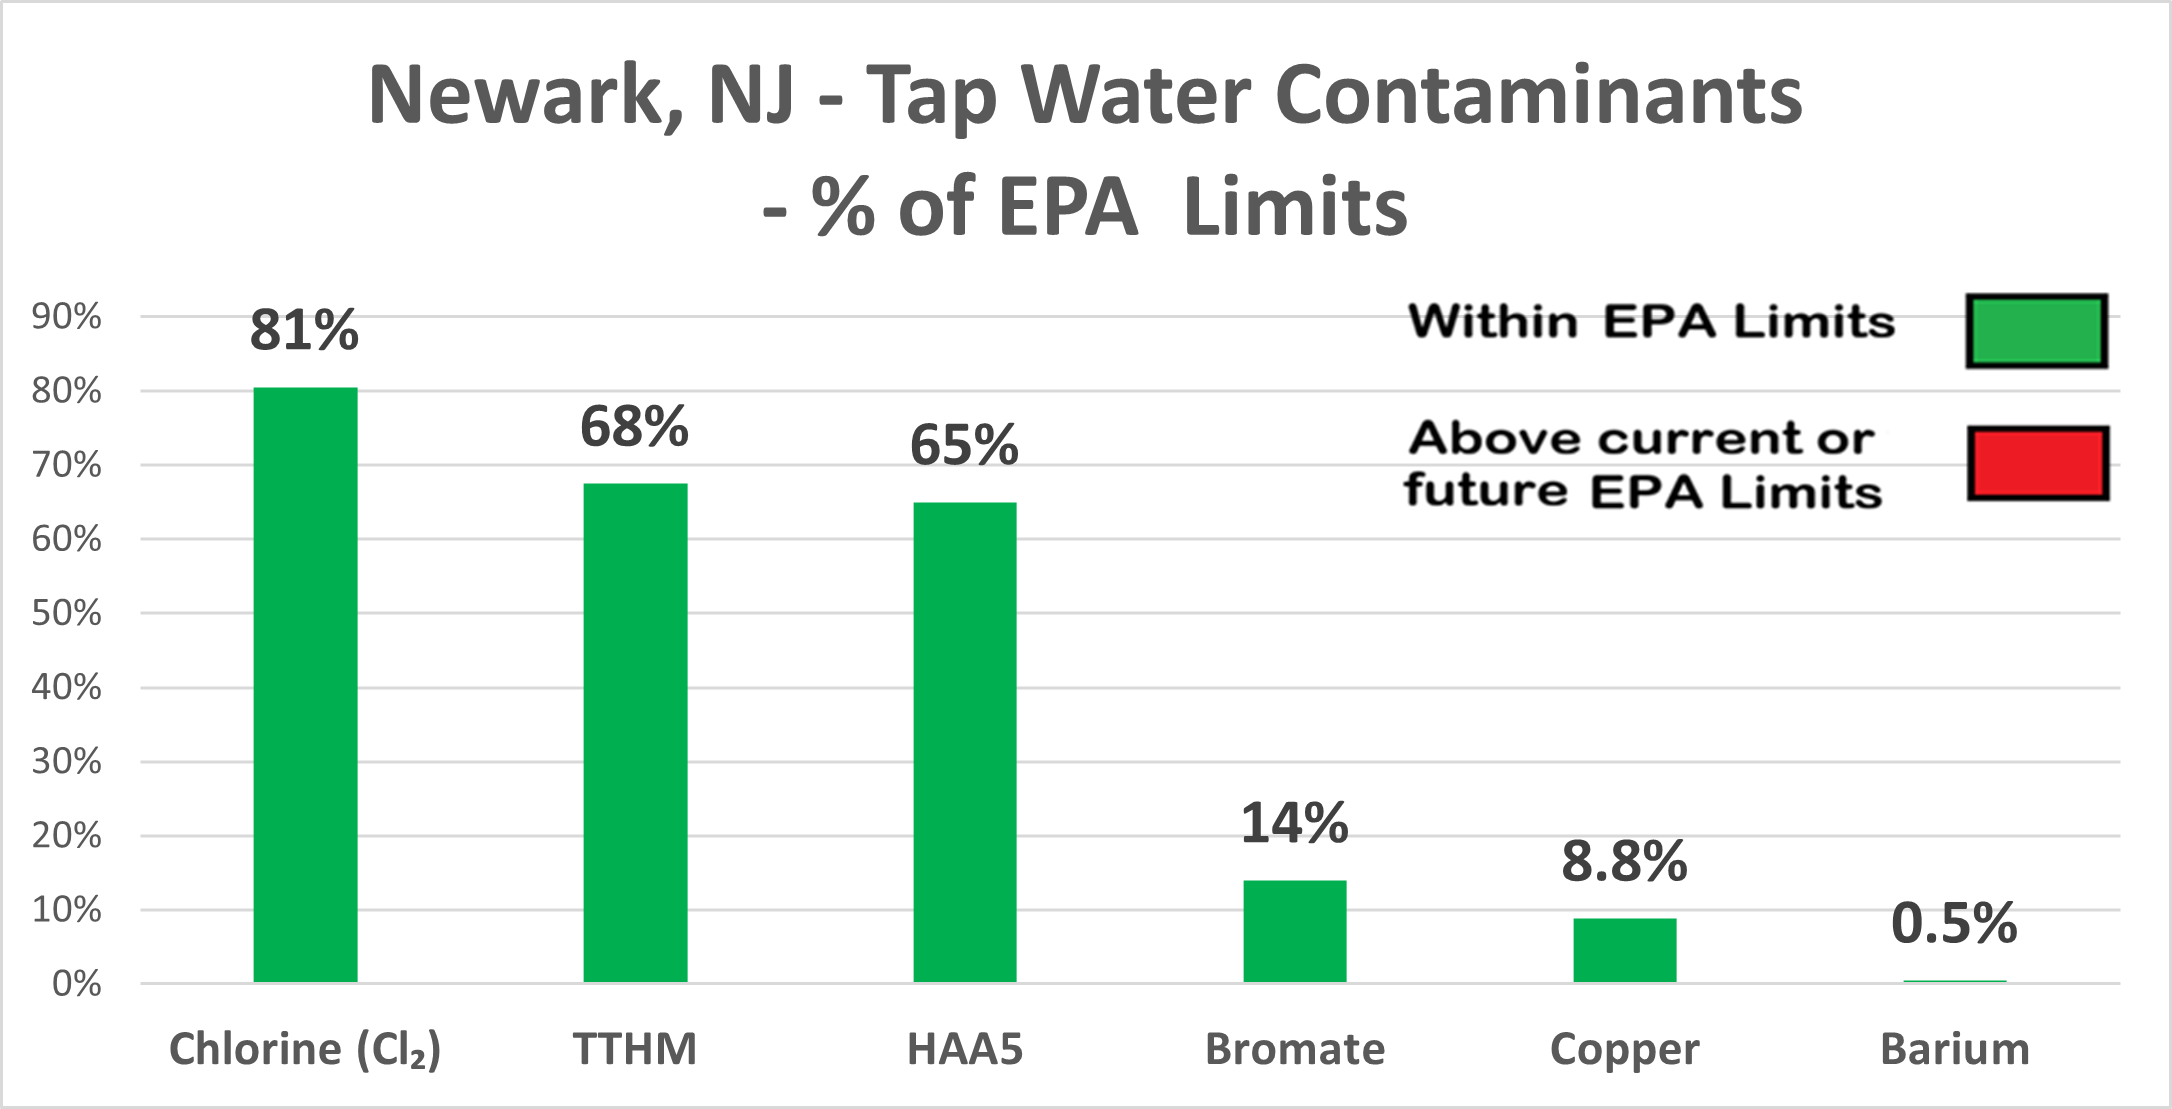
Heavy Metals
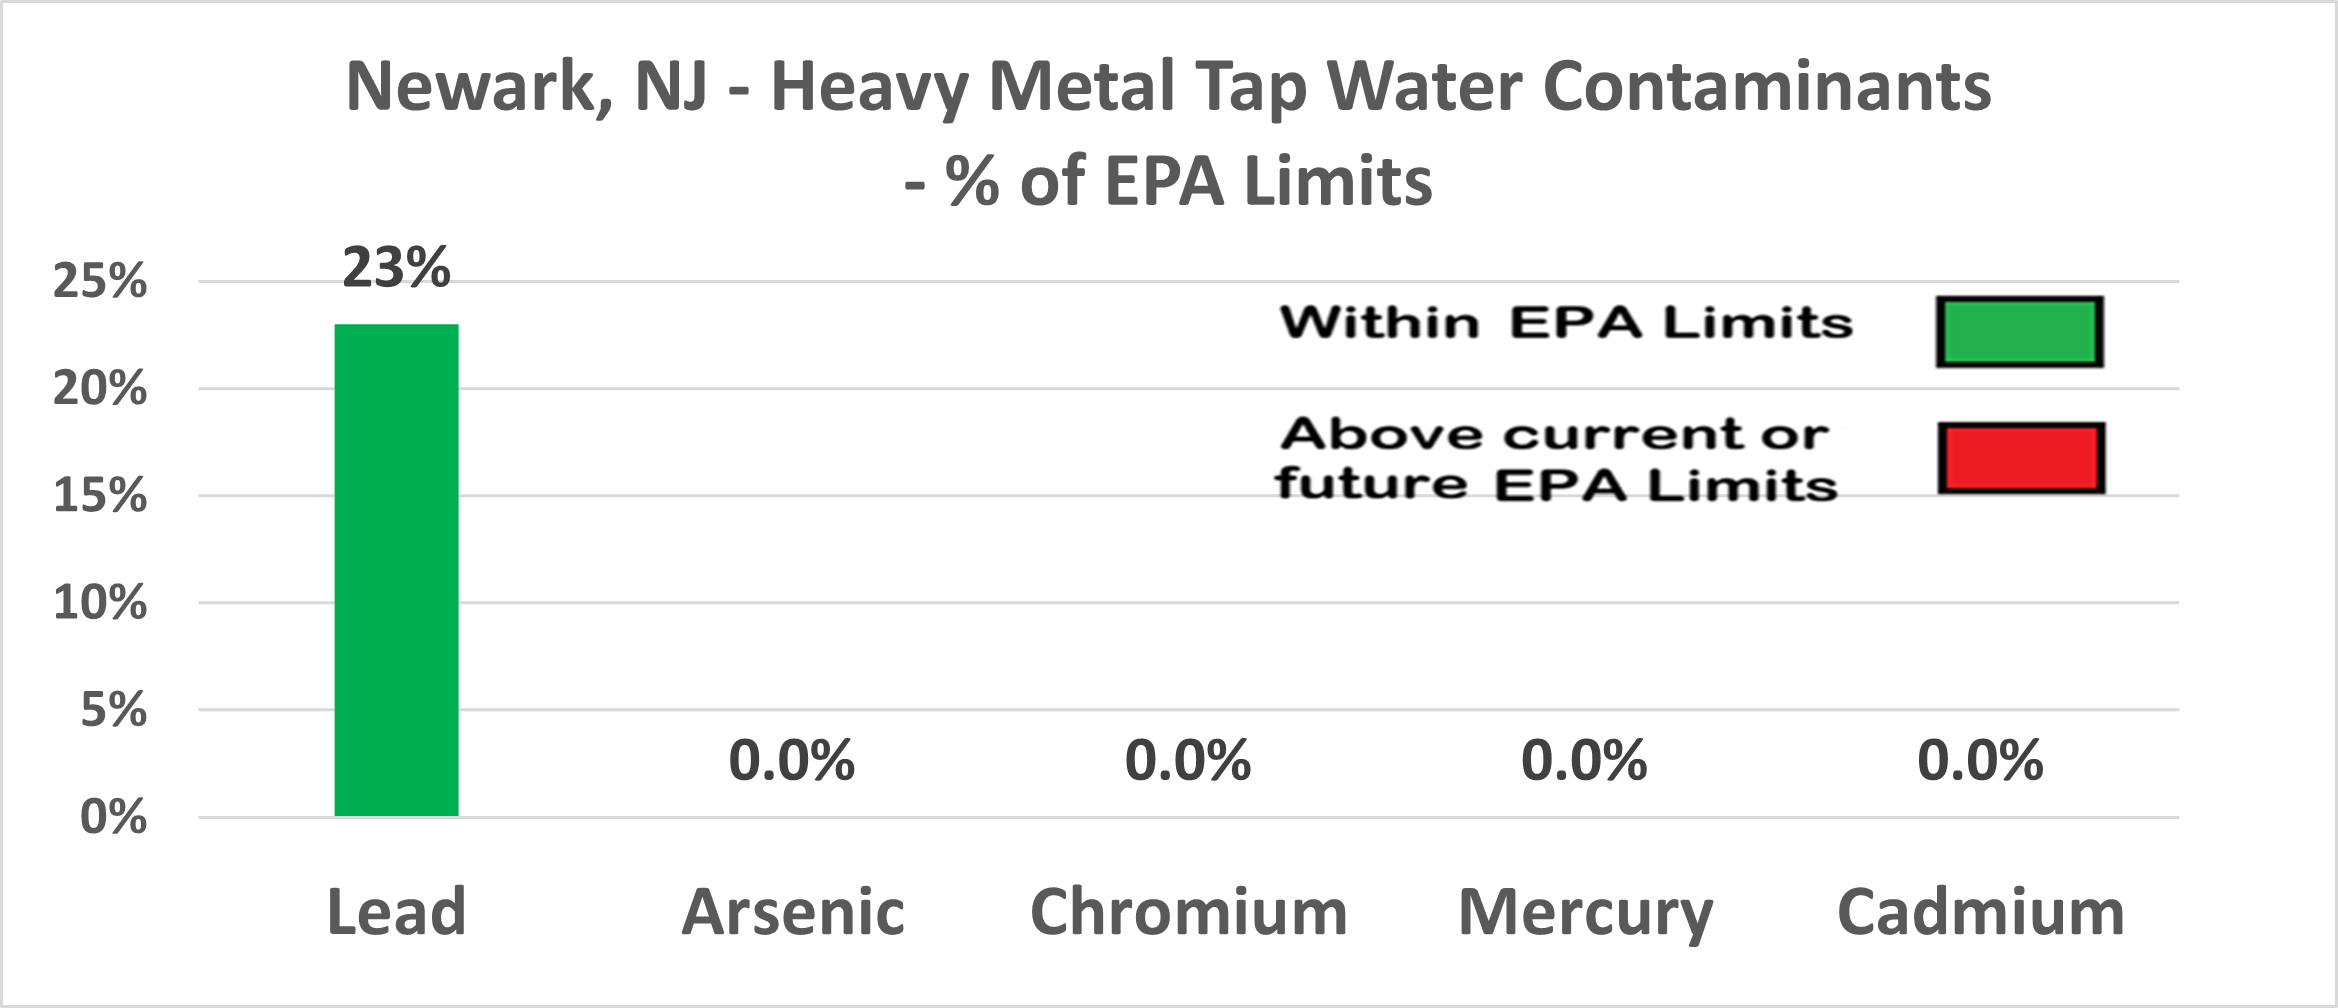
The EPA regulates five heavy metals in drinking water: lead, arsenic, chromium, mercury, and cadmium. These metals can enter water through natural deposits, industrial pollution, or corroding pipes.
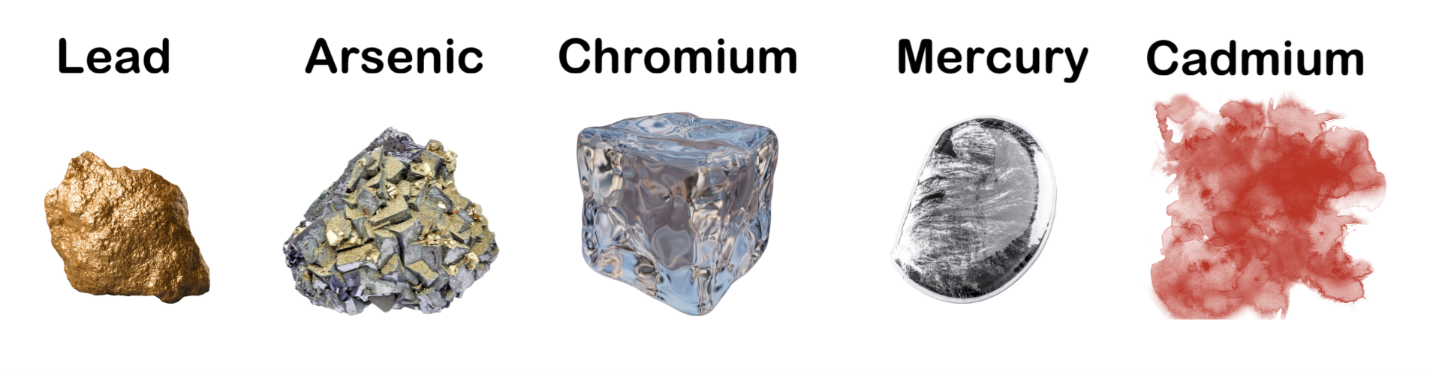
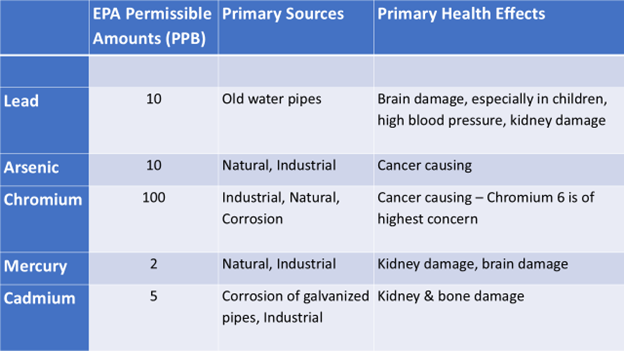
Newark tested positive only for lead at 2.3 ppb, which is 23% of the 10 ppb EPA standard. Arsenic, chromium, mercury, and cadmium were not detected. While lead levels are low, they are worth monitoring.
PFAS (Forever Chemicals)
PFAS, or per- and polyfluoroalkyl substances, are a group of man-made chemicals created in the 1930s by bonding Carbon and Fluorine, two elements that do not naturally combine. This unnatural bond makes PFAS extremely stable and resistant to breaking down, earning them the nickname "forever chemicals."

Newark generally maintains low PFAS levels, within federal and state limits.
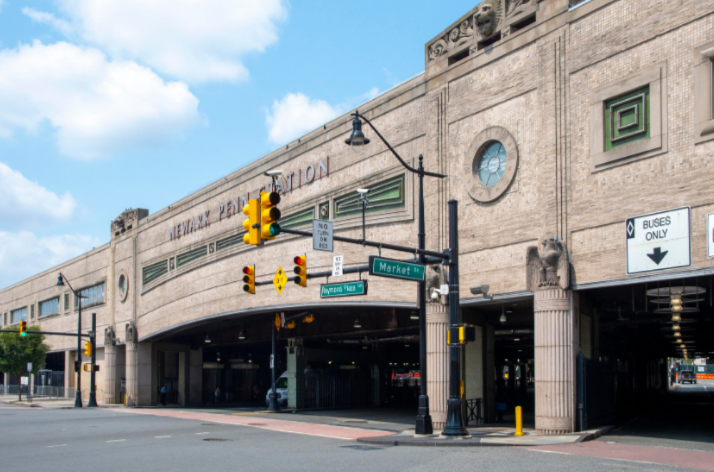
Historic Newark Penn Station
Other Contaminants
No other significant contaminant issues were detected in Newark's water supply.
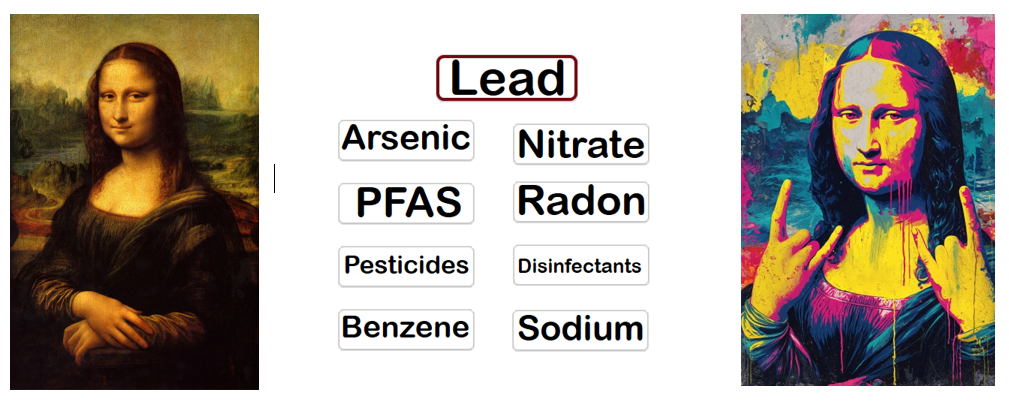
Our Grading System
Water is nature's masterpiece – like the Mona Lisa hanging in the Louvre. Just as adding splatters of paint would diminish Leonardo's work, contaminants reduce water's purity. Our grades reflect the extent of this "contamination," with one important exception: fluoride, which many communities add intentionally for dental health. We don't penalize water for fluoride addition.
We evaluate water quality based on the toxicity of each contaminant, the level at which it is present, as well as the cumulative impact of all detected contaminants.
How Does Newark Compare Locally?
The B+, Good rating is actually well above average for the local area. Nearby Orange, New Jersey with no detectable lead, arsenic or forever chemicals, was the only local municipality to rate excellent.
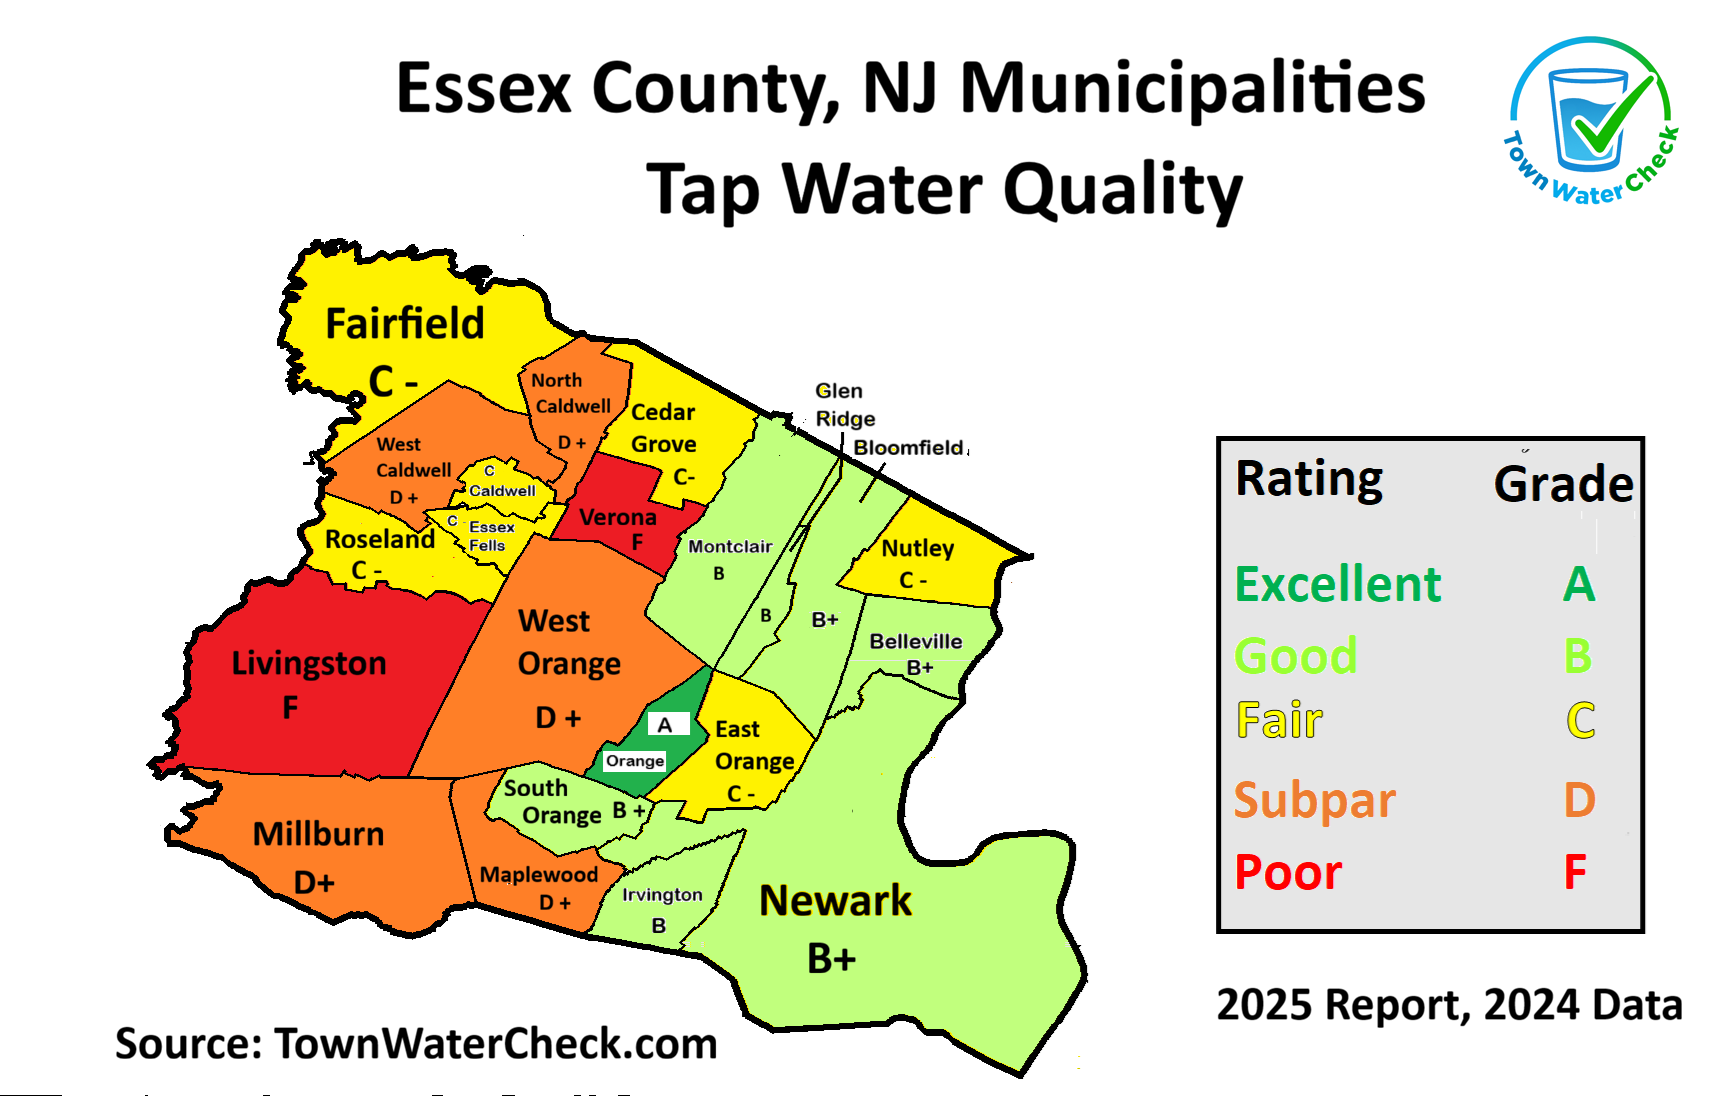
Better than Newark:
Orange (A)
Similar to Newark:
Belleville (B+), Bloomfield (B+), South Orange (B+)
Our Filter Recommendation
Even though the levels of PFAS and heavy metals in Newark tap water are modest, we still recommend using a reverse osmosis (RO) type filter with a NSF/ANSI 58 standard. Alternatively, some Carbon Block filters with an NSF/ANSI 53 rating may also be effective.
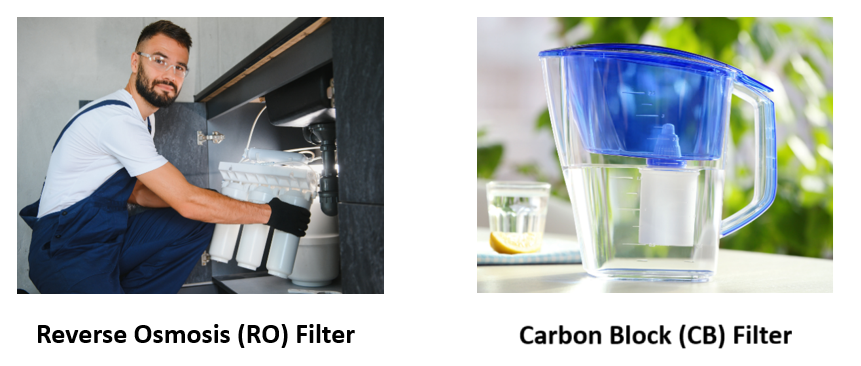
Just ensure they are certified to remove your particular water contaminants. If you would like to find out more about these filters, please visit: www.townwatercheck.com/water-filter-selection
Note: The Consumer Confidence Report does not indicate active water fluoridation in Newark.

Newark's vibrant downtown skyline at night
Final Thoughts
We hope that our tap water information has proven helpful.
Notes:
- • For the latest tap water information, check with your water provider or municipality.
- • Relatively recent discoveries that even miniscule PPT (parts per trillion) levels of PFAS are harmful, and the resulting legislation, have created a very challenging situation for water supply companies, since commercial filtration infrastructure cannot be changed overnight.
- • The influence of contaminants on health relates to chronic, long-term, not acute or immediate effects. We make no claims, positive or negative, regarding tap water safety.
- • Sampled tap water data tends to be more conservative than the average glass of tap water, often citing the 9th worst of 10 samples.
- • The information contained in this report may not reflect the views of our advisors.
- • Please contact Town Water Check if you feel we have made an error.
- • For purposes of consistency, we use EPA limits throughout this report, not state or local limits.
Town Water Check wishes you a healthy and informed life and a cleaner, more beautiful planet.
Disclaimer: The Town Water Check grading system is our opinion, based on measured contaminant levels as well as the known effects on long-term human health. Others may reach a different conclusion. This report was published in 2025 and is primarily based on 2024 data. For the most current information, please consult your water provider or municipality.